Tracing
Overview
Section titled “Overview”Every prompt execution produces a .tracy file in the .runs/ directory next
to your .prompty file. The extension includes a custom editor (registered as
prompty.traceViewer) that opens these files in a rich, interactive trace
viewer built with React.
The viewer breaks each run into its pipeline stages — load → render → parse → execute → process — so you can see exactly what happened at every step, how long it took, and how many tokens were consumed.
The .tracy Format
Section titled “The .tracy Format”.tracy files are JSON trace data. The extension registers .tracy as a custom
language in VS Code and automatically associates these files with the trace
viewer custom editor.
Each file captures the full trace tree for a single execution, including nested frames for every pipeline stage, timing information, token counts, and the complete request/response payloads sent to the model provider.
Navigating Traces
Section titled “Navigating Traces”The Traces panel in the Prompty Explorer sidebar gives you quick access to all recorded runs:
- Sort by date (newest first) or sort by name using the toolbar buttons
- Refresh the list after new runs to pick up the latest
.tracyfiles - Click any trace to open it in the viewer
- Traces are grouped by workspace folder when you have a multi-root workspace open
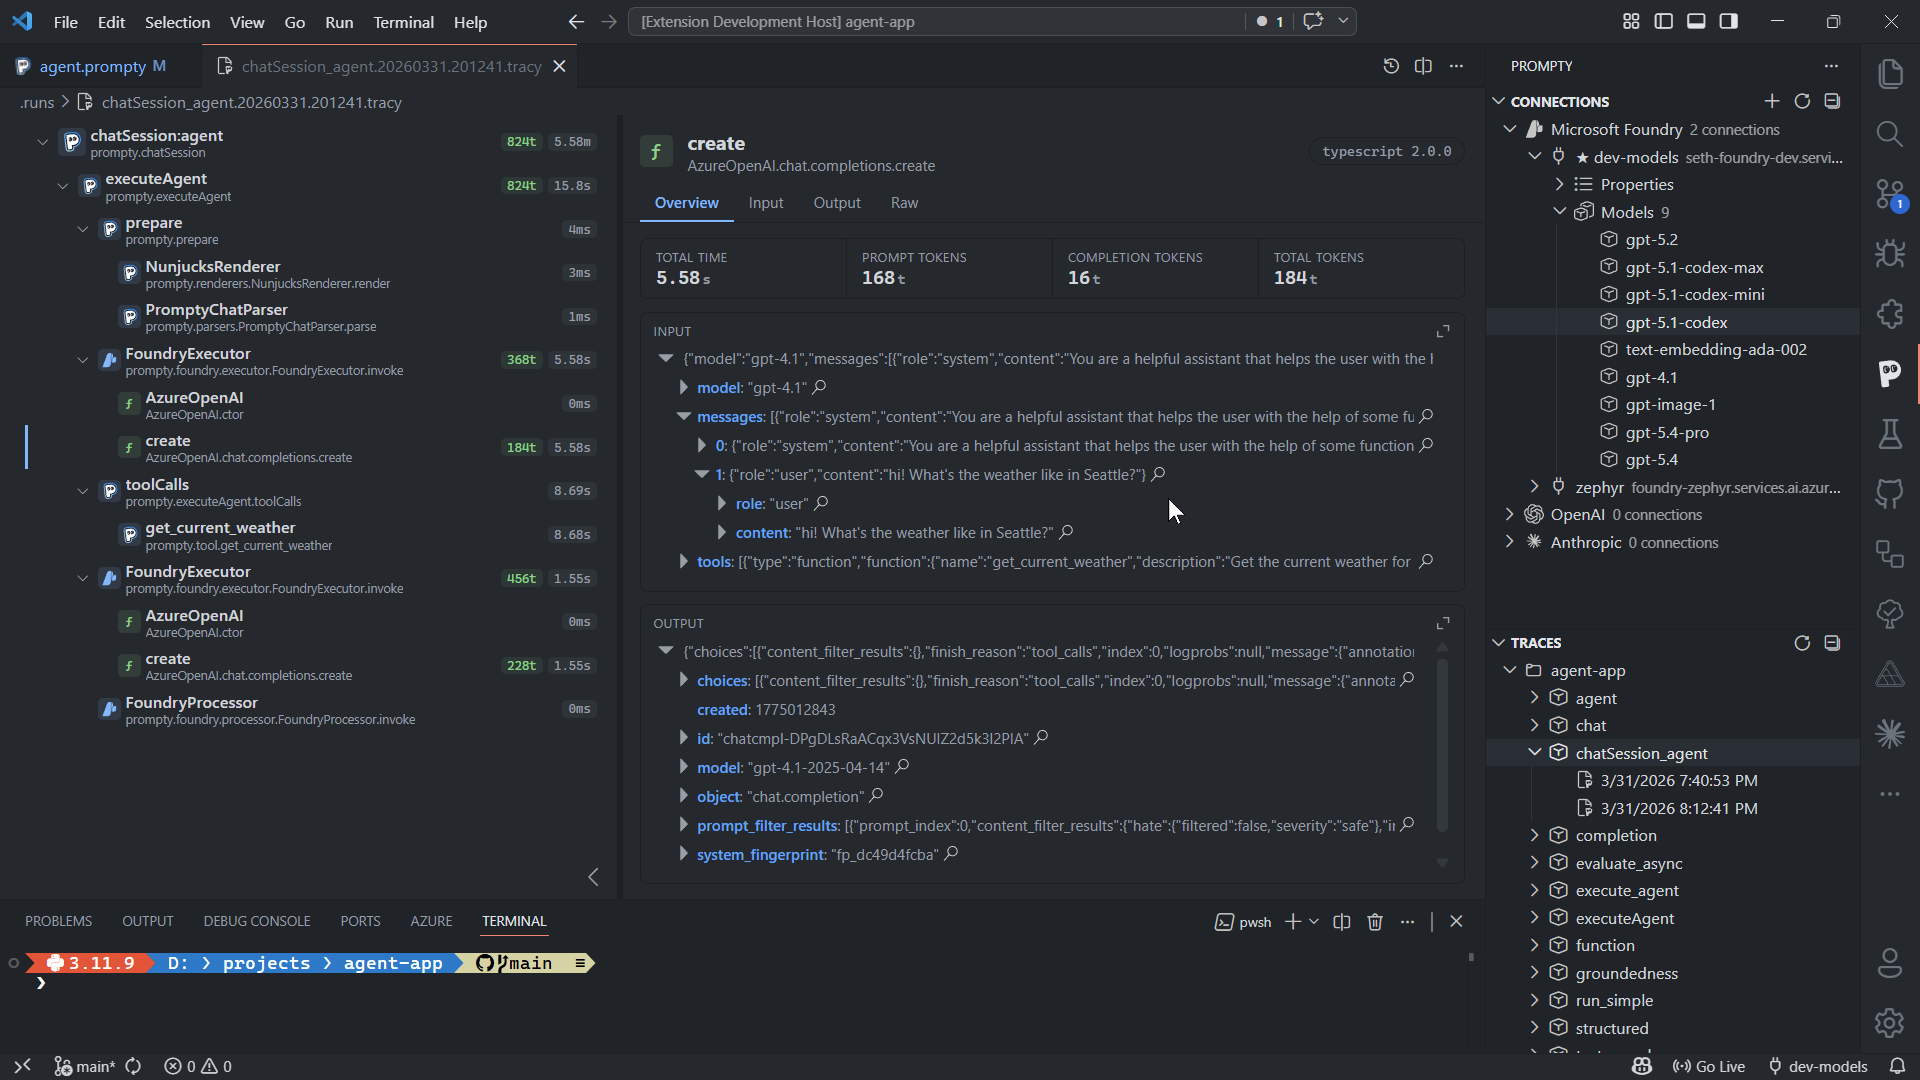
Trace Viewer Layout
Section titled “Trace Viewer Layout”The viewer is split into two main areas: a sidebar tree on the left and a detail panel on the right.
Sidebar Tree
Section titled “Sidebar Tree”The collapsible tree shows every trace frame in the execution:
- Frame names —
load,render,execute,process, and any custom stages - Duration badges — how long each stage took in milliseconds
- Token usage counts — prompt and completion tokens at a glance
- Provider icons — visual indicators for OpenAI, Azure, Anthropic, and other providers
- Nested child frames — expand complex operations to see sub-steps (e.g., individual tool calls inside an agent loop)
Click a frame in the tree to populate the detail panel with that stage’s data.
Detail Panel
Section titled “Detail Panel”The detail panel has five tabs:
| Tab | Contents |
|---|---|
| Overview | Execution time, token counts (prompt + completion), and expandable input/output inspectors |
| Conversation | Reconstructed message flow for agent loops and chat sessions, with role labels for system, user, assistant, and tool messages |
| Input | The data passed into this pipeline stage |
| Output | The data returned from this pipeline stage |
| Raw | Complete unprocessed trace data as JSON |
Working with Traces
Section titled “Working with Traces”A few practical tips for day-to-day use:
- Add
.runs/to your.gitignore— trace files are local debugging artifacts and shouldn’t be committed to source control - Each run creates a new
.tracyfile with a timestamp in the filename, so you never lose previous traces - Chat mode sessions produce a single trace covering all turns in the conversation, making it easy to review the full exchange
- Compare traces side by side by opening multiple
.tracyfiles in separate editor tabs — useful for spotting differences after changing your prompt or model options